

Same market. Same year. Six research houses. An eleven-fold spread. One firm published two forecasts of the travel eSIM market eight months apart that differ by a factor of 112.
That is the first thing anyone writing about this industry should know, and almost nobody says it. It is also why we built this page.
eSIMTweaks has been buying, installing and testing travel eSIMs since 2021. I keep a spreadsheet of every gigabyte I have personally bought abroad, now past 900 rows, and the thing that becomes obvious after a few years of that is how much of the published data on this market is recycled, undated, or quietly wrong.
So this is the eSIM statistics report we wanted to exist. Forty numbers, each with its publisher and its publication date attached, so you can check every one.
Two datasets we compiled ourselves because nobody else publishes them: an app install league table across twenty travel eSIM brands, and a twelve-month seasonality index showing when demand for each destination actually peaks.
And a section on six widely quoted eSIM statistics that do not survive being checked, including the single most cited roaming figure in the industry, which turns out to be a twelve-year-old vendor press release misattributed to a standards body.
The ten eSIM numbers that matter most
eSIM Market size: the estimates disagree by eleven times
| Publisher | 2026 market size | Forecast | CAGR | Dated |
|---|---|---|---|---|
| Coherent Market Insights | $23.1bn | $66.3bn by 2033 | 16.3% | 13 Jul 2026 |
| Grand View Research | $12.8bn | $17.7bn by 2033 | 4.7% | Jun 2026 |
| Straits Research | $12.43bn | $27.63bn by 2034 | 10.5% | 3 Jun 2026 |
| Fortune Business Insights | $2.12bn | $7.62bn by 2034 | 17.3% | 20 Jul 2026 |
| MarketsandMarkets | $1.14bn (2024 base) | $8.23bn by 2035 | 20.0% | Sep 2026 |
| Mordor Intelligence | 0.65bn units | 2.12bn units by 2031 | 26.67% | 6 Aug 2026 |
The reason for the spread is definitional rather than sloppy. Some counts include eSIM hardware and platform software, some count only consumer connectivity revenue, some count IoT and some do not. But almost nobody publishing these numbers says which they are counting, which is why the figures get quoted interchangeably.
eSIM adoption rate by country, and what is actually published
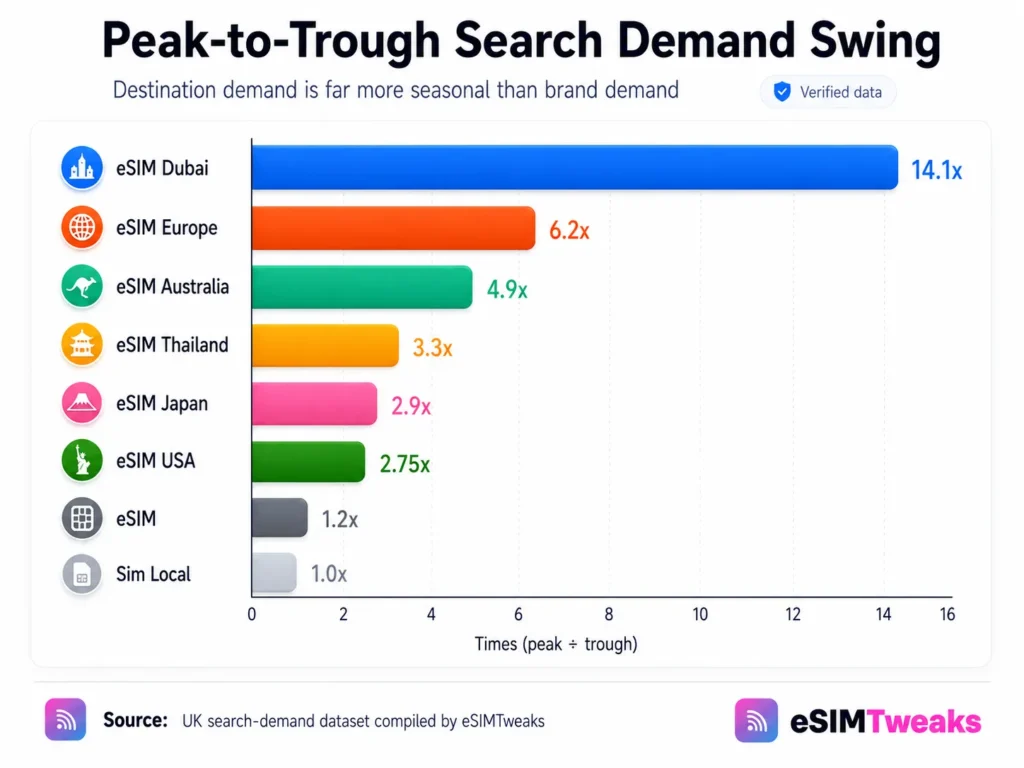
Before the numbers, a warning about eSIM statistics by country. Detailed national penetration data sits inside GSMA Intelligence's paid trackers. Every free country-by-country adoption table we could find online carries no primary source at all. The figures below are the ones that are genuinely public.
Our data: the eSIM app install league table
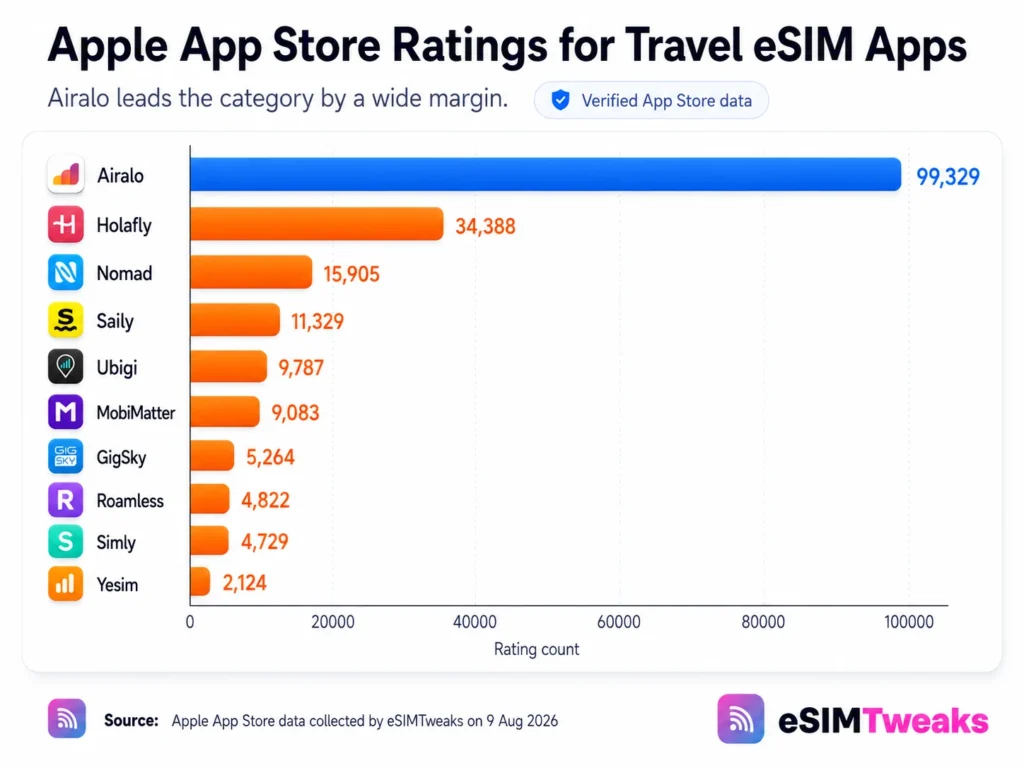
Nobody publishes this, so we compiled it. Every figure below was read from the public Google Play listing and Apple's own lookup endpoint on 9 August 2026. Apple rating counts are exact integers rather than the rounded labels shown on store pages.
| Install band | App | Play rating | Play reviews | Apple ratings |
|---|---|---|---|---|
| 10M+ | Airalo | 4.5 | 177,000 | 99,329 |
| 5M+ | Saily | 4.6 | 92,800 | 11,329 |
| 5M+ | Holafly | 4.8 | 67,900 | 34,388 |
| 5M+ | BNESIM | 3.2 | 12,800 | 118 |
| 1M+ | MobiMatter | 4.7 | 26,400 | 9,083 |
| 1M+ | Yesim | 4.7 | 24,400 | 2,124 |
| 1M+ | Nomad | 4.6 | 15,100 | 15,905 |
| 1M+ | Ubigi | 4.0 | 7,180 | 9,787 |
| 1M+ | Flexiroam | 2.7 | 4,450 | 247 |
| 500K+ | GigSky | 4.6 | 4,270 | 5,264 |
| 500K+ | aloSIM | 4.5 | 3,170 | 1,241 |
| 500K+ | Roamless | 4.7 | 2,070 | 4,822 |
| 100K+ | Global YO | 4.4 | 5,290 | 588 |
| 100K+ | GoMoWorld | 4.6 | 3,700 | 432 |
| 100K+ | Firsty | 4.5 | 3,280 | 514 |
| 100K+ | Simly | 4.6 | 1,780 | 4,729 |
| 100K+ | RedteaGO | 4.0 | 1,210 | 869 |
| 100K+ | Jetpac | 3.6 | 1,090 | 217 |
| 50K+ | Sim Local | 4.8 | 859 | 559 |
| 10K+ | Maya Mobile | 4.3 | 323 | 397 |
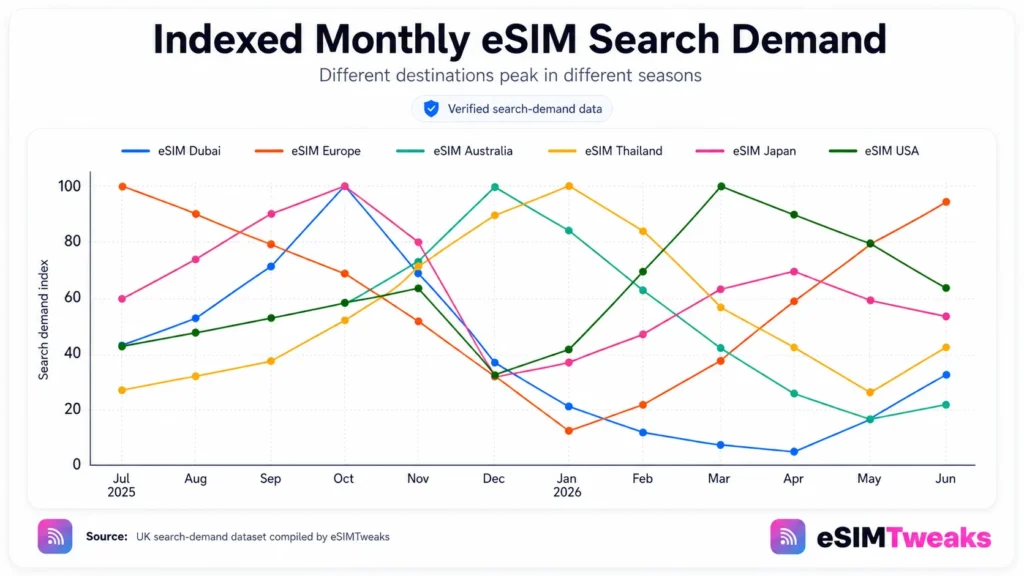
Our data: eSIM statistics and trends by season
This is the dataset we find most useful internally and have never seen published anywhere else. It is twelve months of UK search demand by keyword, which is the closest available proxy for purchase intent in a market where nobody discloses unit sales.
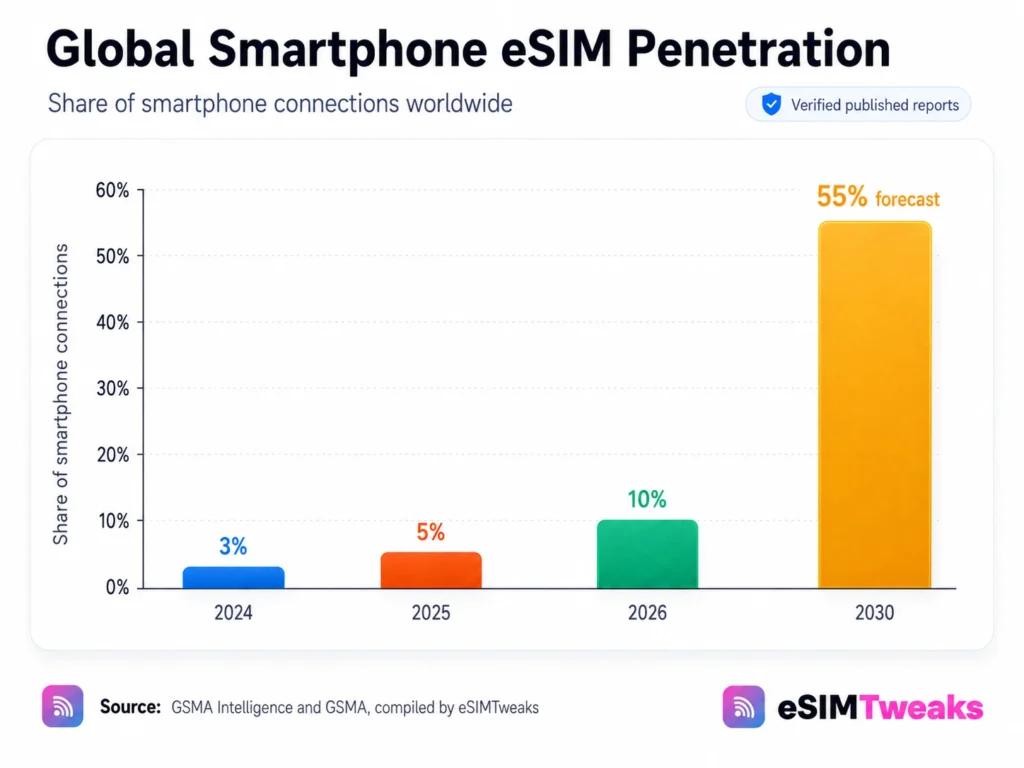
| Search term | Peak month | Peak volume | Trough | Swing |
|---|---|---|---|---|
| eSIM Dubai | October 2025 | 2,400 | 170 (April 2026) | 14.1x |
| eSIM Europe | July 2025 | 8,100 | 1,300 (January 2026) | 6.2x |
| eSIM Australia | December 2025 | 2,900 | 590 (May 2026) | 4.9x |
| eSIM Thailand | January 2026 | 2,900 | 880 (May 2026) | 3.3x |
| eSIM Japan | October 2025 | 2,900 | 1,000 (December 2025) | 2.9x |
| eSIM USA | March 2026 | 6,600 | 2,400 (December 2025) | 2.75x |
| eSIM (generic) | July to November 2025 | 60,500 | 49,500 | 1.2x |
| Sim Local (brand) | Flat all year | 2,400 | 2,400 | 1.0x |
What eSIM data actually costs?
Pilgrimage and event travel
Those two numbers together explain why religious travel is now a distinct product category rather than a footnote, and why several providers have started building plans around it. If you are travelling for either, we have separate guide for Umrah and Saudi Arabia.
Six eSIM statistics that are wrong
These six figures appear across dozens of eSIM articles, but each needs closer source checking before being cited.
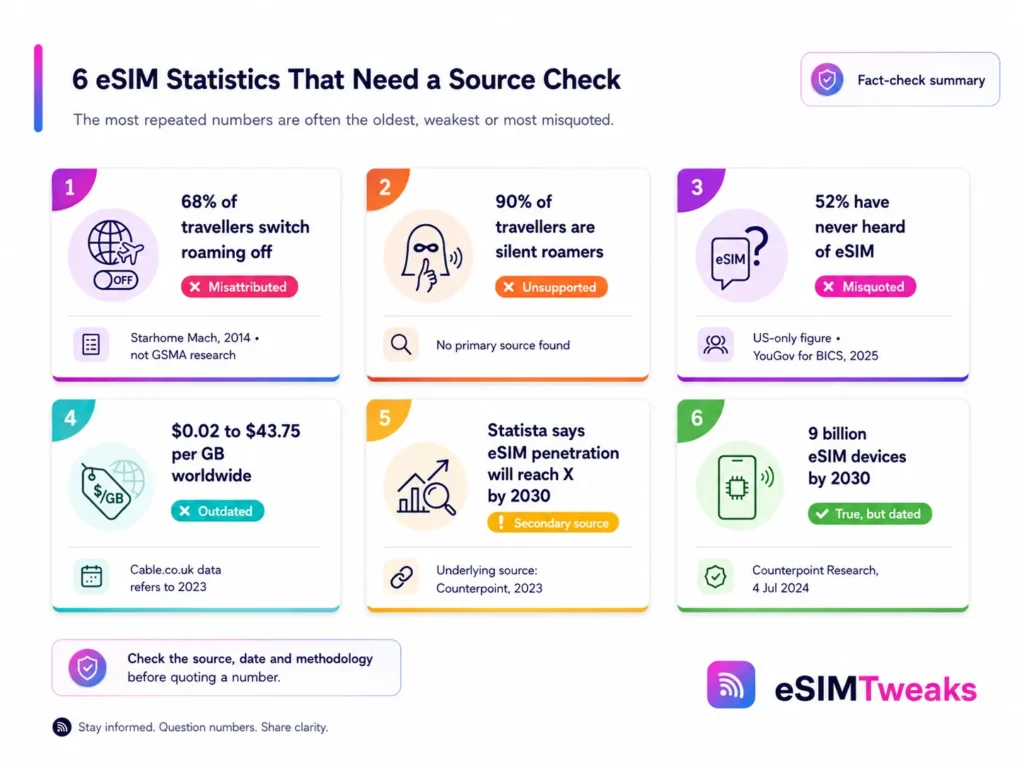
GSMA never published this. The figure comes from Starhome Mach, a roaming services vendor, in July 2014, derived from its own analytics platform with no published sample size or methodology. It is attributed to the GSMA because it is hosted on gsma.com, in the section where the GSMA republishes its member companies' press releases. It is a vendor release on a standards body's domain, and it is twelve years old.
There is no source for this at all. It appears to be an inflation of the 2014 figure above. Properly sourced alternatives exist: Kaleido Intelligence puts silent roamers at around 20% of global travellers, and found in a June 2024 survey across 20 markets that 70% of them would adopt a travel eSIM if one were available.
This one is real but routinely misquoted. It comes from YouGov for BICS, n=6,625, fieldwork February to March 2025, and the 52% is the United States figure only. The global figure in the same survey is that 33% know what an eSIM is, with a further 21% who have heard of it without understanding it. BICS sells eSIM enablement to operators, so it is also a vendor-commissioned finding. And it is contradicted by newer work: CCS Insight found 74% UK awareness in December 2025.
Accurate in 2023. The figures come from Cable.co.uk's worldwide pricing study, and the most recent year in that study's own historical table is 2023. Several sites republish the identical numbers under 2026 headlines.
Statista is not the source. Its flagship eSIM statistic credits Counterpoint Research and is dated 5 June 2023, and the numbers sit behind a paywall. Anyone citing Statista on eSIM is citing a three-year-old Counterpoint projection at second hand.
True, and published by Counterpoint Research on 4 July 2024. It appears in “eSIM statistics 2026” roundups constantly, undated, as though it were new.
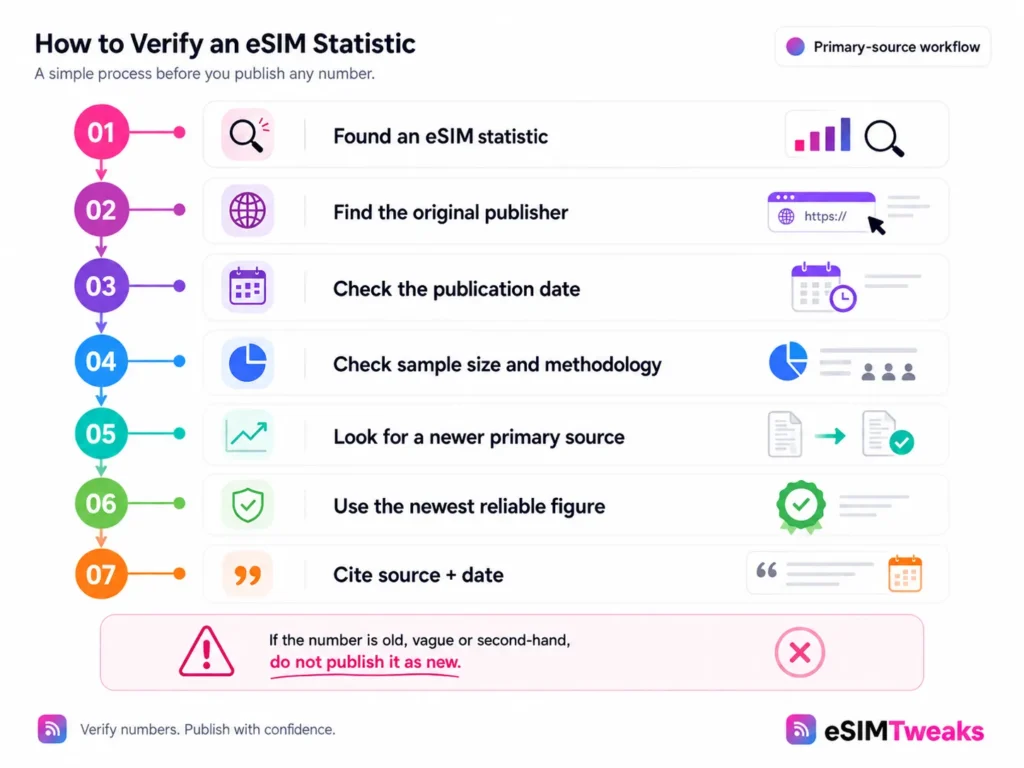
There is a pattern here. The eSIM statistics that circulate most widely are the ones that are oldest, most quotable and least checkable, and they get laundered into credibility by being repeated. If you are citing a number from this industry, find the primary source and the date before you publish it. We have named both for all forty numbers above.
What this means, depending on who you are?
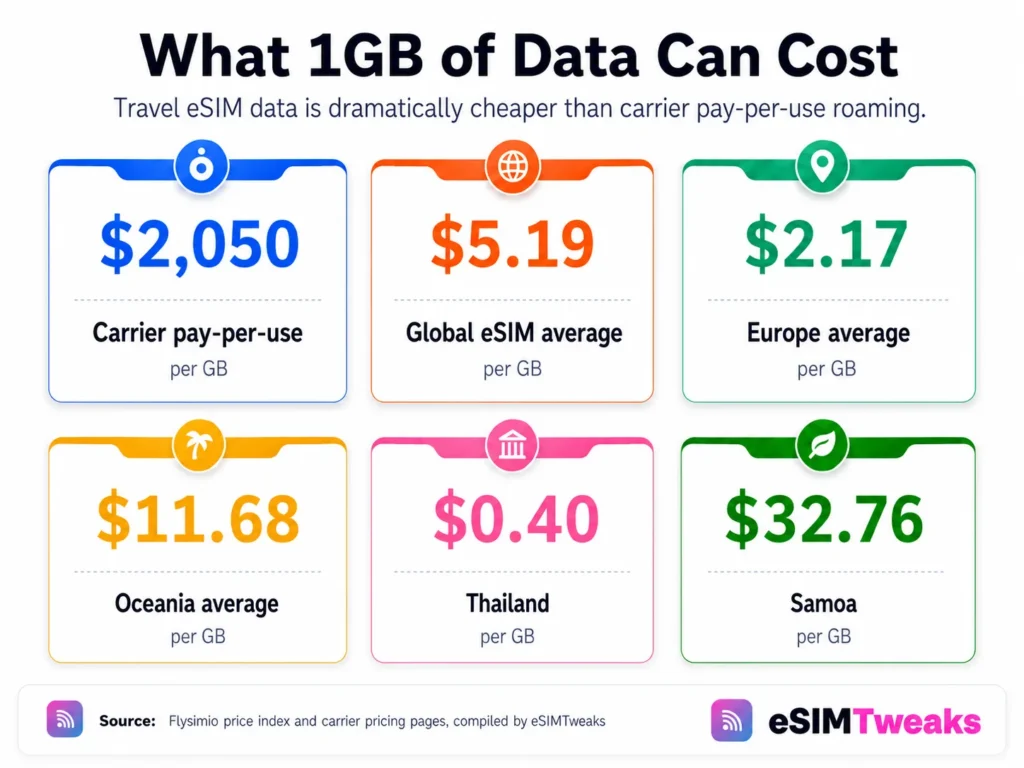
If you are a traveller. Two numbers change your behaviour and the rest are context. Carrier pay-per-use at $2,050 per gigabyte against a prepaid data plan at roughly $5 makes the purchase obvious, and it is why international roaming is now the expensive way to get mobile data abroad rather than the default.
The 87.5% roaming finding tells you why your eSIM feels slower than the local network, and it is a fair trade for convenience rather than a fault.
If you are covering this market. Do not use a single market-size figure. The honest presentation is a range with the publishers named, because an eleven-fold spread is not a rounding difference, it is a definitional one. And check the six statistics above before you repeat them.
If you are approving connectivity as an expense line. The number that matters is that 73% of operators now offer eSIM, which means your existing carrier probably has a product, and it will almost certainly cost more per gigabyte than a travel eSIM while being far easier to expense.
Most consumer travel eSIM providers still cannot supply a consolidated invoice, a VAT receipt or per-line usage reporting. If those are your requirements, you are buying a corporate roaming product and should say so at the outset.
How we compiled this?
The 40 figures above come from three kinds of source, and we have kept them separate on purpose.
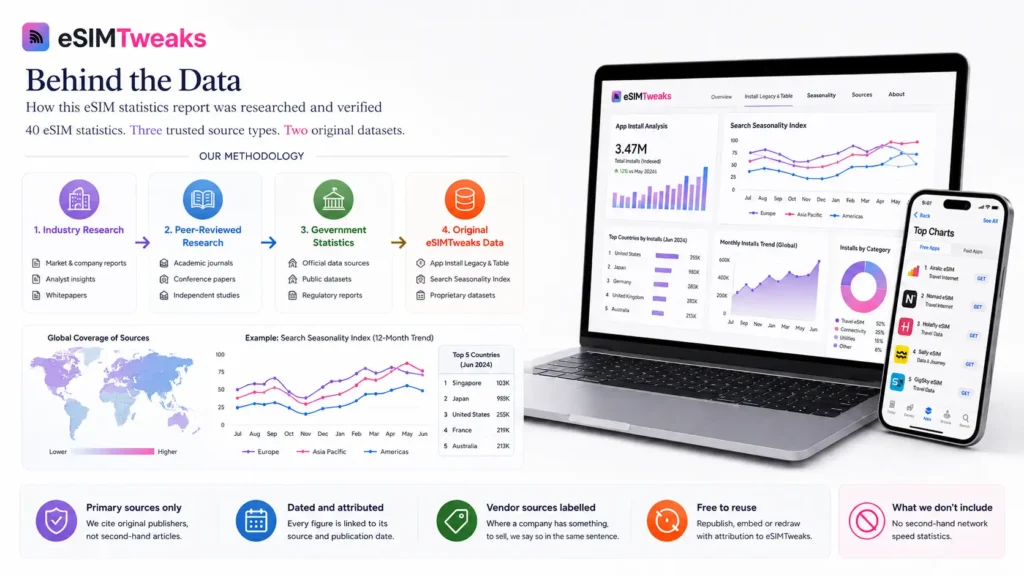
Primary industry research from firms that run their own data collection: GSMA and GSMA Intelligence, Juniper Research, ABI Research, Counterpoint Research, Kaleido Intelligence, Ericsson and CCS Insight. Peer-reviewed academic work, specifically the ACM Internet Measurement Conference 2025 study on travel eSIM routing, which remains the only independent measurement of a travel eSIM at scale and which we have dated carefully because its underlying plan inventory is from May 2024. And government statistics offices for pilgrimage numbers.
One deliberate omission. We have published no network speed figures here, because the credible sources for those are Ookla's Speedtest Global Index and Opensignal's national reports, and both should be read directly rather than quoted second hand. Speed claims in this category are otherwise almost entirely vendor-issued.
Where a figure comes from a company with something to sell, we have said so in the same sentence. That applies to the Flysimio price index and the BICS awareness survey, both of which are useful and both of which are vendor-run.
The app install table and the seasonality index are ours. The install data was read from public Google Play listings and Apple's lookup endpoint on 9 August 2026, using exact rating counts rather than rounded page labels. The seasonality index covers twelve months of UK search demand to June 2026. Neither is a sales figure, because no provider in this market publishes unit sales, and anyone who tells you they know the market share of travel eSIM brands is estimating.
The charts on this page are free to reuse. Republish, embed or redraw any figure here, editorially or commercially, with attribution to eSIMTweaks and a link to this page. The two original datasets, the app install league table and the seasonality index, are ours, and we will share the underlying data with anyone who asks.
Frequently asked questions
How big is the eSIM market in 2026?
Published estimates range from $2.12 billion to $23.1 billion, depending on whether the figure counts hardware, platform software, consumer connectivity, IoT or some combination. For travel eSIM specifically, Juniper Research puts 2025 revenue at $1.8 billion and Kaleido Intelligence at $3.3 billion. Cite a range and name the publisher rather than picking one figure.
What percentage of phones use an eSIM?
Around 5% of global smartphone connections were eSIM at the end of 2025, forecast to reach 10% by the end of 2026 (GSMA). The United States is far ahead at roughly 30% and accounts for close to half of all eSIM users worldwide.
How fast is the eSIM market growing?
Published CAGRs range from 4.7% to 26.7%, which tells you more about definitional differences than about growth. The most reliable single growth figure is Juniper Research's count of total eSIM connections, up 30% from 1.2 billion in 2025 to 1.5 billion in 2026.
How much does eSIM data cost per GB?
The global average across 2,668 plans in 184 countries is $5.19 per gigabyte, ranging from $2.17 in Europe to $11.68 in Oceania (Flysimio, July 2026, vendor-run). By comparison, AT&T and Verizon both charge $2.05 per megabyte for pay-per-use international data, which is $2,050 per gigabyte.
Which eSIM app has the most downloads?
Among dedicated travel eSIM apps, Airalo is the only one in the 10 million plus Google Play install band, with 177,000 Play reviews and 99,329 Apple ratings as of 9 August 2026. Saily and Holafly follow in the 5 million plus band.
Are eSIM statistics available by country?
Only partially, and this is worth knowing before you cite any. The United States adoption rate of roughly 30% is publicly sourced to GSMA Intelligence, and the UK awareness figures come from CCS Insight. Detailed country-level penetration sits inside GSMA Intelligence's paid trackers. Every free eSIM statistics by country table we could find online carries no primary source at all.
How do I install an eSIM once I have chosen one?
You buy it online before you travel and install it by scanning a QR code or tapping an install button in the provider's app. The profile downloads over wifi in about two minutes, then sits dormant until you switch it on at your destination. Our guide to how an eSIM actually works covers the mechanism behind QR code activation in detail.
Are travel eSIMs banned in any country?
One country has a documented regulatory action. India's Department of Telecommunications had Airalo and Holafly removed from Indian app stores in January 2024 because they lacked a No Objection Certificate, and commercial use of foreign SIMs inside India remains prohibited. Turkey is widely reported to block provider websites and apps from July 2025, though no regulator statement documents it. Claims about Brazil, the UAE, Oman and Kuwait trace to a single article naming no regulator or law.
Why is my travel eSIM slower than the local network?
Because it is almost certainly roaming rather than running natively. Research presented at the ACM Internet Measurement Conference in 2025 found 21 of 24 tested country plans were roaming, that 78.8% of roaming measurements delivered 15 Mbps or less, and that latency ran 64% higher on hub-breakout routing and 621% higher on home-routed traffic.
Data & Citation: Original eSIMTweaks charts and datasets may be cited or reproduced with attribution and a link to this report.